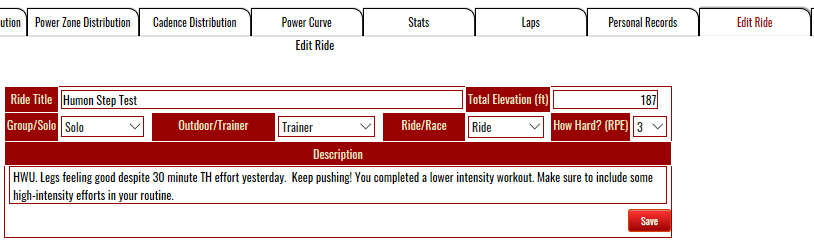
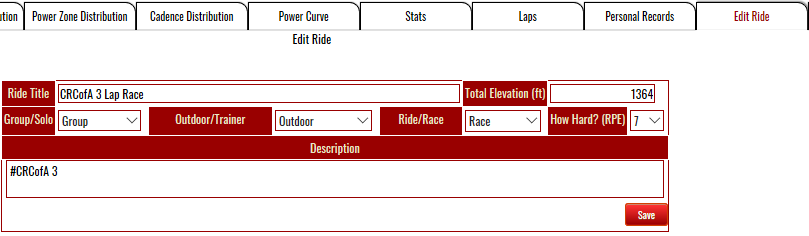
You provide a Start Date and an End Date to limit the rides you want to report on. Additionally, you can enter in a Tag to further limit the rides returned by the search. The system will attempt to match the tag on a "contains" basis in the Description column of a ride. The corresponding Description textarea is found on the Edit Ride tab of each ride page.
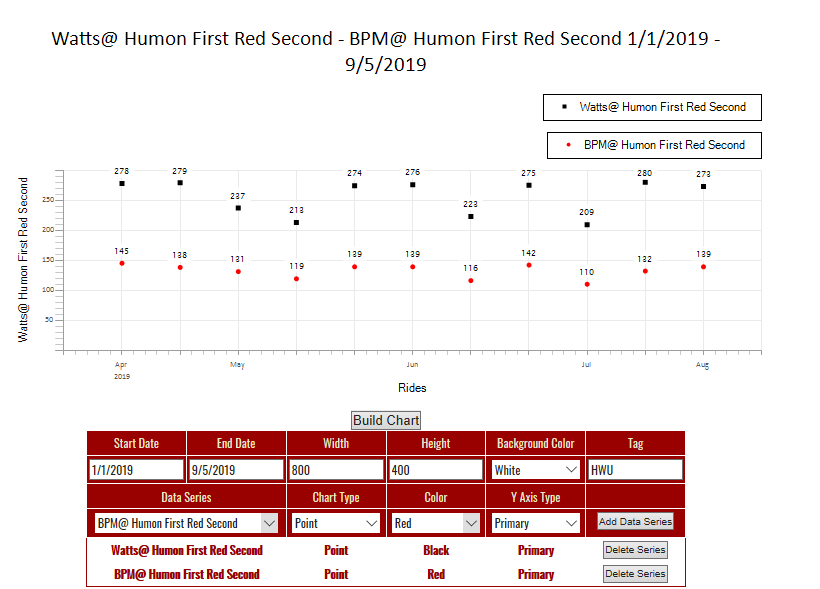
There is a special tag (HWU) which stands for Humon Warm Up. It's supposed to used on rides where you're performing a threshold test using the Humon protocol. There are 2 statistics that are meant to be used with respect to Humon threshold tests: Watts @ Humon First Red Second and BPM @ Humon First Red Second. Although these statistics will still work with untagged rides, they are pretty meaningless when done outside of a threshold test, and they will impart a big performance hit to graph display when done in this context.
You also must provide a Width and Height for the chart (in pixels) and select a background color (either White or Black).
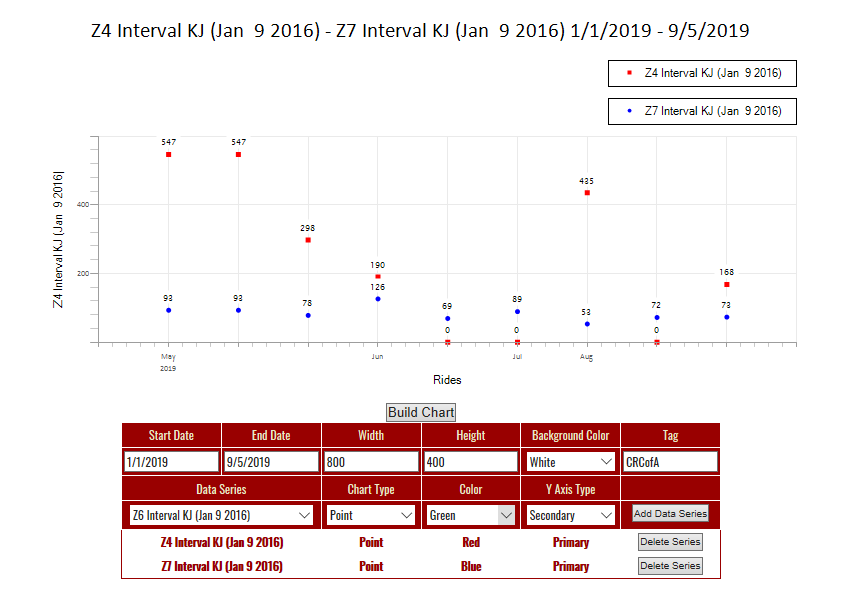
You must also select at least one, and not more then 6 Data Series per graph. You configure a Data Series by selecting the name of the series along with the Chart Type (either line or point), Color, and Y Axis Type (either Primary or Secondary). When you are done configuring a series you click the [Add Data Series] button to add the series to the list of series that will eventually be displayed on the graph. After adding a series to the graph, you can delete it by clicking on the [Delete] button for that series. When you are done configuring Data Series's you click the [Build Chart] button to build the chart.
The charts are implemented as images. If you are using a desktop browser you should be able to use that browser's utility to save the image to your local file system if so desired. For instance in Firefox/Win XP you can right click on an image and click [Save As] from the ensuing context menu.
Here's an example of a chart that's displaying all the Humon threshold tests for 2019: